Innovative Ways to Visualize Data from Multiple Fitness Trackers
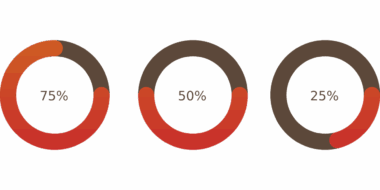
With the rapid advancement in fitness tracking technology, a myriad of devices and apps have emerged. Many users now own multiple tracking devices, including smartwatches, fitness bands, and smartphone apps. These devices offer valuable insights into user health and activity levels. However, a frequent challenge is integrating data from multiple sources into a cohesive format. One innovative approach to address this issue is to use data visualization techniques. By employing graphs, charts, and interactive dashboards, users can efficiently interpret data across various platforms. Various software tools can aggregate information from multiple sources, allowing for comparative assessments. For instance, integration can help users assess sleep patterns against workout intensity. Visualizing these patterns can highlight correlations that guide training decisions and promote healthier lifestyles. Moreover, data can be represented in user-friendly formats, making it easier for users to track their progress holistically. By leveraging these innovative visualization methods, users gain clearer insights into their fitness journeys. This ultimately assists in setting goals and supports more effective decision-making for personal well-being.
In addition to using conventional graphs and charts, innovative visualization techniques can include infographics and heatmaps. Infographics are particularly effective in conveying complex data in an accessible format. By summarizing key information visually, users can quickly grasp their overall fitness status. Heatmaps can illustrate activity patterns over time, showing peak performance periods throughout the week or month. This detailed representation can inform users about their best exercise days, optimizing scheduling to improve overall fitness outcomes. Additionally, integrating multimedia elements, such as videos and animations, can enhance user engagement with their data. Apps can use gamification to encourage users by representing milestones in a fun way. Another effective strategy involves implementing social sharing features. Users feel more motivated when they can share accomplishments with friends and track their progress through social comparisons. Visual tools can also highlight competition and collaboration among friends or community members. This social element can significantly enhance user motivation, as they see the results of their hard work visually represented. Overall, visualization offers broader accessibility and engagement, making fitness data easier to understand, enjoy, and act upon.
The Role of Apps and Software
Many apps and software tools are now specifically designed to consolidate fitness data from multiple tracking devices. These applications have revolutionized how users interact with their data and offer seamless integration across platforms. Users can select from popular fitness tracking applications that sync data from various sources, enabling a holistic view of their fitness journey. Examples include platforms like MyFitnessPal and Fitbit, which allow data exports and imports to create comprehensive profiles for users. With these tools, graphical representations can display important metrics, such as caloric burn and daily step trends, making it easier for users to understand their progress visually. Furthermore, these apps often provide personalized insights and recommendations based on aggregated data. Such insights can guide users in making informed decisions for their health. Integration with community features, such as forums and challenges, allows users to share specific achievements and participate in group activities. Customized alerts can also help keep users on track. As these technologies progress, the potential for further enhancing user engagement and comprehension grows, leading to improved fitness outcomes.
Integration of various health metrics, including heart rate, sleep quality, and workouts, can result in compelling data visualizations. Users are more likely to act on insights when they see them blended together for greater clarity. For instance, users might track how sleep quality affects their workout performance through a combined visual representation. This interconnected approach to visualizing fitness data empowers users to understand relationships between different factors impacting their health. By reviewing visualizations, users can identify patterns such as how eating habits correlate with energy levels during workouts. The use of color-coding in visual data can also enhance understanding, helping users quickly grasp changes over time. Trends can emerge visually, making connections between overall lifestyle choices and fitness performance clear and actionable. Furthermore, these innovative analytics help create a sense of accountability, motivating users to make necessary lifestyle adjustments. Engaging users through visuals encourages them to take charge of their fitness journey confidently. Their progress becomes quantifiable and sensational when translated into a visual format, drawing attention to achievements and motivating users to enhance their commitment.
Wearable Technology’s Impact
Wearable technology has bridged the gap when it comes to tracking and monitoring fitness data. These devices enable real-time data collection and visualization, providing immediate feedback to users about their activities. Wearables can track a variety of metrics, including heart rate, distance traveled, and calories burned, and sync this data with mobile applications for comprehensive insights. Many of these devices now come equipped with user-friendly displays, designed to present information clearly and concisely. This ease of access encourages users to stay informed about their performance. Furthermore, advancements in wearable technology allow for more personalized insights, tailoring feedback based on users’ historical data. This customization makes visualizations even more relevant and impactful, as users can observe personalized trends over time. Additionally, wearables can send notifications to users when they meet or exceed specific fitness goals, fostering a deeper connection between users and their data. This constant interaction encourages personal accountability and promotes healthy habits. As wearable technology continues to evolve, we can expect further innovations in how data is collected, processed, and visualized.
To maximize the benefits from multiple fitness trackers, interoperability has become crucial. The capacity for various devices and apps to communicate seamlessly enhances user experience significantly. As manufacturers recognize the importance of integration, we can expect more devices to adopt open platforms and APIs allowing third-party app developers to facilitate seamless connections. This interoperability leads to an extensive compilation of data, which can be visualized meaningfully. Furthermore, the push toward data standardization ensures that fitness metrics globally aligned, benefitting users regardless of the brands they own. As more users adopt a blend of devices, this cross-platform functionality will allow individuals to choose the devices that work best for them. Efforts in standardization can also reduce data fragmentation, ensuring users see a consolidated view of their health. It’s not just about tracking fitness metrics anymore; it’s about merging lifestyle choices, wellness activities, and health records into cohesive narratives. Future tech developments promise heightened personalization and insights to help users better achieve their fitness goals through intuitive visualizations, enabling them to live healthier lives.
Conclusion and Future Perspectives
In conclusion, the innovative ways to visualize data from multiple fitness trackers harness new technology to improve overall user engagement. As the reliance on technology for tracking health continues to increase, the need for effective data integration becomes paramount. Technologies like enhanced visualization tools will likely evolve further, bringing advanced analytics to users, and providing deeper insights into their fitness journeys. Additionally, the combination of social features and gamification will help ensure users stay motivated. An increasing number of studies are showing how visual representation of fitness data can enhance user motivation. As the industry progresses, we can expect to see more sophisticated solutions that not only collect data but present it in life-changing ways. The future of fitness tracking lies in comprehensive visual narratives that inform users’ decisions and guide them on their personal wellness journeys. Collaborations among tech developers, healthcare professionals, and researchers will be essential for achieving these goals. Users will benefit immensely as innovation drives the evolution of tracking methods, making health management more effective, insightful, and engaging.
From interactive dashboards that allow users to dig deeper into their fitness history to customizable visual representations, the future will be bright for fitness enthusiasts. As data visualization technology improves, we will likely see advanced functionalities such as predictive analytics, which help users foresee their fitness trajectories based on past data. It will ensure that individuals feel positive impact from the integration of their multiple fitness trackers, leading to healthier lifestyles and better overall well-being. By continuing to embrace these innovative solutions, users can harness their fitness data more completely. In summary, the blending of multiple tracking devices into a single, manageable view empowers users to engage deeply with their health journeys. This comprehensive view promises not only to enhance self-awareness but also encourages proactive health measures, leading to long-term positive lifestyle changes. As the fitness and technology landscapes continue to evolve, integrating tracking systems in bold and meaningful ways will undoubtedly shape the next level of personal training and wellness management.